Unlike specialized industrial Alkaline batteries, this battery type from Duracell (Alkaline-Manganese Dioxide Battery) can be found in almost any store. Because of its availability and relatively detailed technical datasheet, this battery model will be used in many of our tutorials. The complete battery designation is “Duracell Ultra Power AA MX1500 MX15UPWE0614”.
In this post, we will introduce the LTspice simulation model of this battery and compare it to the battery datasheet. For more knowledge about Alkaline Batteries, check out this post: Alkaline Batteries
AA BATTERY DIMENSIONS
Dimensions shown on drawing below are IEC standards.
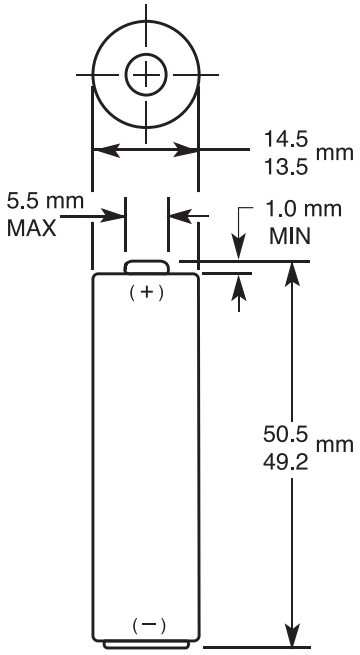
TYPICAL AA ALKALINE BATTERY CHARACTERISTICS
| NOMINAL VOLTAGE | 1.5 V |
| TYPICAL CAPACITY | 2500 mAh |
| IMPEDANCE | 81 mOhm @ 1 kHz |
| TYPICAL WEIGHT | 24 g (0.8 oz) |
| TYPICAL VOLUME | 8.4 cm3 (0.5 in3) |
| TERMINALS | Flat |
| STORAGE TEMPERATURE | 5°C to 30°C (41°F to 86°F) |
| OPERATING TEMPERATURE | -20°C to 54°C (-4°F to 130°F) |
| DESIGNATION | IEC: LR6 |
CONSTANT CURRENT DISCHARGE CURVES
These are typical discharge curves from the technical datasheet of the battery. These curves will be compared to the LTspice simulation model. It should be noted that there may be some differences in real-world applications due to the nature of electric batteries and capacitance dependence on factors such as actual load, temperature, humidity, etc.
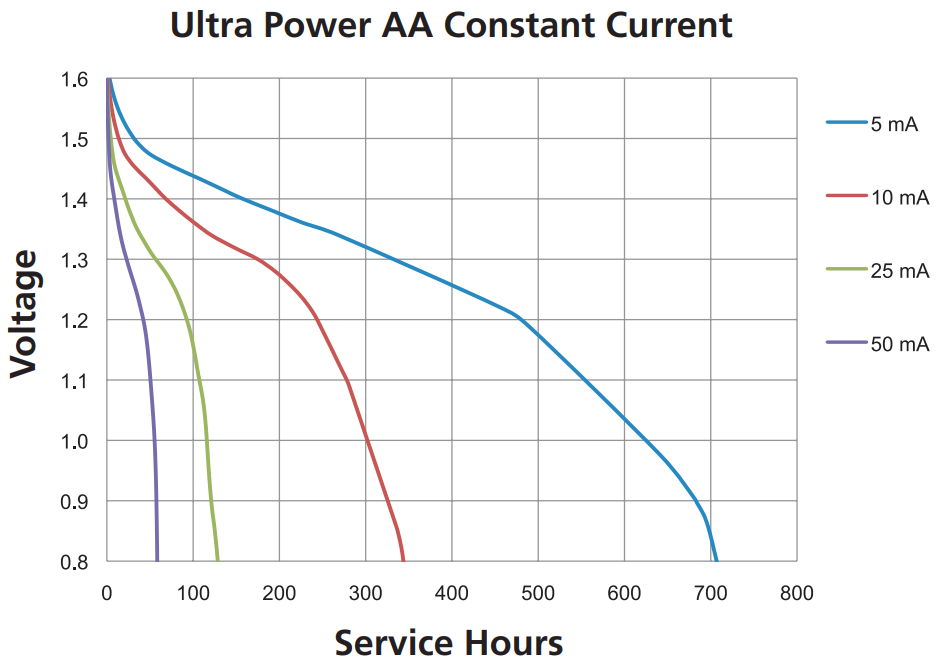
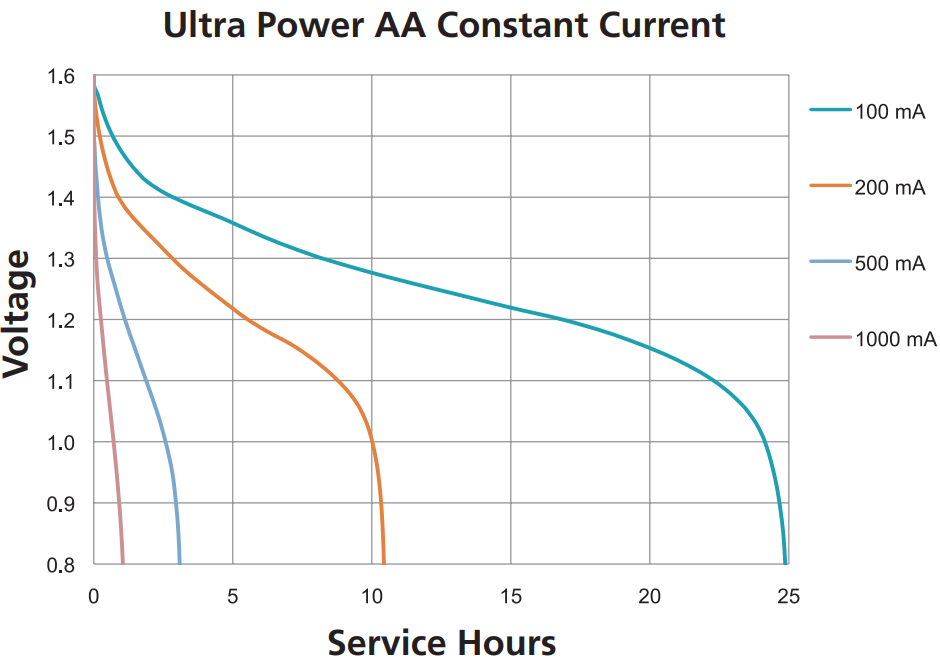
The table presents battery service hours relative to constant current load, with a 0.8V cut-off voltage.
| CONSTANT CURRENT LOAD | SERVICE HOURS |
| 5 mA | 705 h |
| 10 mA | 342 h |
| 25 mA | 127 h |
| 50 mA | 57 h |
| 100 mA | 24 h |
| 200 mA | 10.5 h |
| 500 mA | 3 h |
| 1000 mA | 1 h |
LTSpice DURACELL 1.5V AA SIMULATION MODEL
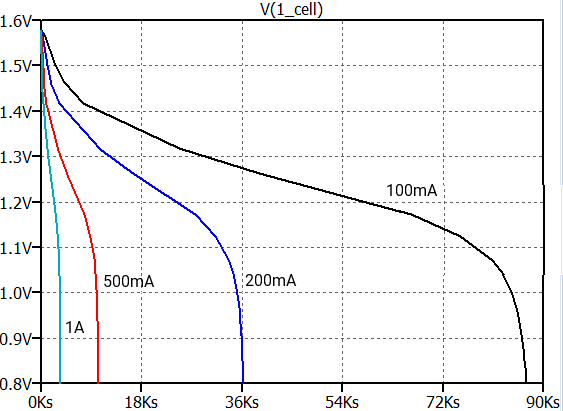
The following graphs show battery discharge under constant current loads, corresponding to those specified in the battery datasheet for comparison purposes.
The first set of curves displays discharge for constant current loads ranging from 100mA to 1000mA:
The second set of curves shows discharge for constant current loads ranging from 5mA to 50mA.
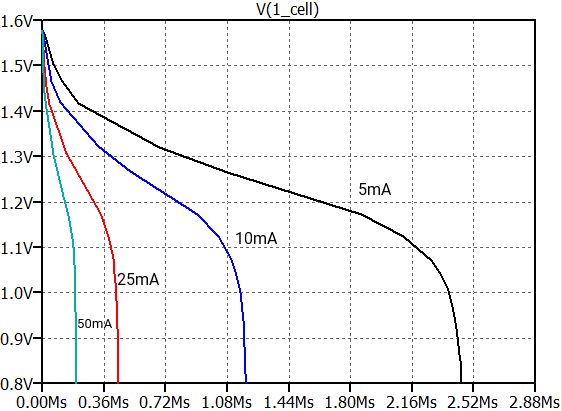
Compared with the datasheet, it can be seen that the best fit for the discharge curve in simulations is between 25mA and 200mA, with the absolute best fit observed at a load of 100mA. These loads are typical current demands found in electronic devices.
Although for smaller loads such as 5mA and 10mA, the discharge curve modeled by this simulation does not match the datasheet exactly, the discharge times are still very similar. Therefore, it can still be used to some extent for small loads.
Discharge time comparisons between simulation and datasheet are presented in the following table:
| CONSTANT CURRENT LOAD | SERVICE HOURS DATASHEET | SERVICE HOURS SIMULATION | DIFFERENCE |
| 5 mA | 705 h | 680 h | -3.5 % |
| 10 mA | 342 h | 330 h | -3.5 % |
| 25 mA | 127 h | 124 h | -2.4 % |
| 50 mA | 57 h | 55 h | -3.5 % |
| 100 mA | 24 h | 24.1 h | +0.4 % |
| 200 mA | 10.5 h | 10 h | -4.8 % |
| 500 mA | 3 h | 2.8 h | -6.7 % |
| 1000 mA | 1 h | 0.92 h | -8 % |
If there is need for battery model for small loads or any other different battery simulation model it can be made upon request so feel free to CONTACT US.
learn more
Datasheet for Duracell Ultra Power 1.5V AA MX1500. This datasheet is used for alkaline battery simulation model creation.
SIMULATION MODEL
AA 1.5V Alkaline Battery Duracell Ultra Power 1.5V AA MX1500


Leave a Reply